







Business Intelligence for construction
In the construction industry, staying on top of your projects is essential. Whether you’re a manager monitoring deadlines or a financial manager keeping costs under control, Business Intelligence for the construction industry offers the solution. At Peacock, we help you consolidate all your data—from systems such as Metacom, 4PS Construct, or Bouw7—and visualize it in Power BI reports. Faster, better decisions and, as a result, greater confidence.
How Business Intelligence Helps Construction Companies Grow
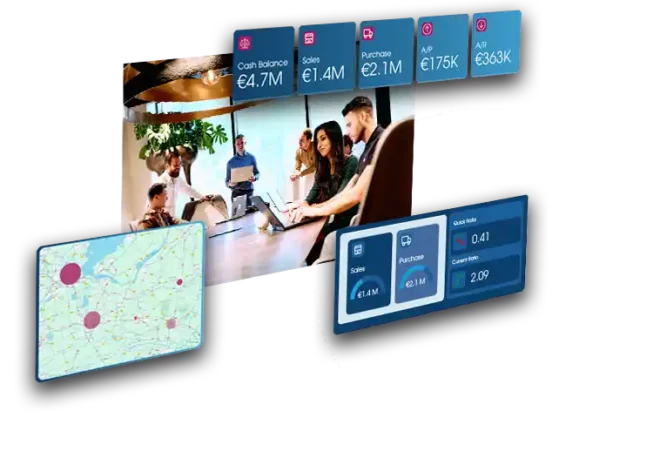
Construction projects generate vast amounts of data: schedules, hours, budgets, final cost calculations, and more. Without the right tools, that information remains scattered and difficult to manage. Business Intelligence for the construction industry changes that. It collects all your data in one place and gives you immediate insight into project performance, cost savings, and margins. This way, as a decision-maker, you have everything you need to steer the business strategically.

Ready-to-use BI solution for Metacom
Peacock and Van Meijel
Are you using Metacom from Van Meijel? Thanks to our close cooperation with Van Meijel, we have developed a ready-to-use Business Intelligence solution especially for Metacom. This extracts all relevant data from your ERP system and displays it in clear dashboards. Project progress, budget monitoring and forecasts? You can see it at a glance in Power BI. And the best thing: you are up and running in no time, without lengthy implementations.

Flexible Business Intelligence for 4PS Construct, Bouw7, or AFAS
Are you working with another system, such as 4PS Construct, AFAS or Bouw7? No worries. Peacock is expert at integrating different platforms. Whether you use one system or combine several, we make sure all your data comes together in a central data warehouse. This makes us flexible and suitable for any construction company, regardless of the software you use.
Data as the basis for success
Deep insights with Business Intelligence
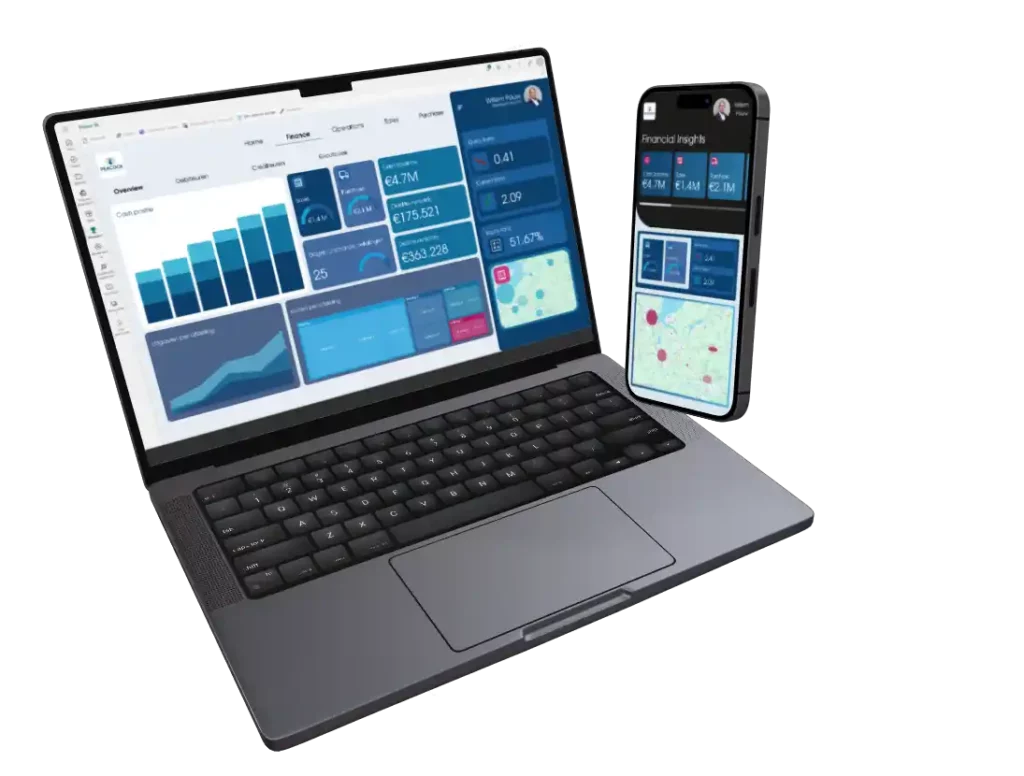
The construction industry demands not only speed in delivery, but also the ability to adapt quickly based on strategic data. A robust Business Intelligence solution helps you transform raw data into clear, easy-to-understand dashboards. We achieve this through a carefully structured step-by-step plan in which every element plays a crucial role.
Step 1: The ETL process - foundation of reliable data
The first step is to extract data from a variety of systems, such as ERP, CRM and spreadsheets. Then this data is thoroughly cleaned and standardized. In this way, we ensure that the information you ultimately use is of high quality. This ETL process forms the basis for all further analysis and provides assurance that you are working with consistent and accurate data.
Step 2: The Data Warehouse - One Central Source
After the ETL process, the cleaned data is stored in a central data warehouse. This offers several advantages:
- Uniform information: All departments work with the same, reliable data set.
- Scalability: Suitable for businesses of any size. The solution grows with your organization.
- Security: Your data is stored and managed to the highest security standards.
This way, you will always have a solid foundation on which to base your financial and operational decisions.
Step 3: Power BI - Insights that speak
The final stage is to visualize the data via Power BI. Our dashboards are designed to present complex information simply and clearly. This allows you to:
- Identify trends and bottlenecks: Instantly see which regions or product lines are performing better.
- Faster decision-making: Actionable insights enable immediate response to change.
- Real-time overview: Always access to the latest data, so you're never behind on market trends.

KPIs with Business Intelligence for the Construction Industry
In the construction industry, it’s crucial to keep a close eye on your performance. With Business Intelligence for Construction, you gain control over your business by managing it based on clear Key Performance Indicators (KPIs), which are immediately visible in your Power BI dashboards. These include:
- More and less work: accurately track how much extra work is created or just phased out, so you can optimize scheduling and budgeting.
- Work in progress: Monitor the progress of ongoing projects to intervene in a timely manner in case of delays or obstacles.
- Employee productivity: Analyze the efficiency and output of your teams so you can respond to capacity and performance gaps.
- Capacity and Planning: Ensure a balanced distribution of work and resources to avoid peak loads and ensure continuity.
- Margin on projects: Evaluate profitability by project and identify opportunities for cost savings and optimization.
- Project progress: Clear insight into the status and development of projects helps you monitor deadlines and budgets.
Discuss your Business Case
Book your 30-minute session with one of our Intelligent Automation specialists.
